Case study
- Banking
- Analytics
- Python
Churn retention
A retention desk for card customers. It scores how likely someone is to leave against what they are worth, recommends one action for each of them, and compares four ways of spending the retention budget on the same book.
- Python
- Analytics

- Role
- Modelling, decision logic and the operator views
- Built with
- Python · Analytics
The challenge
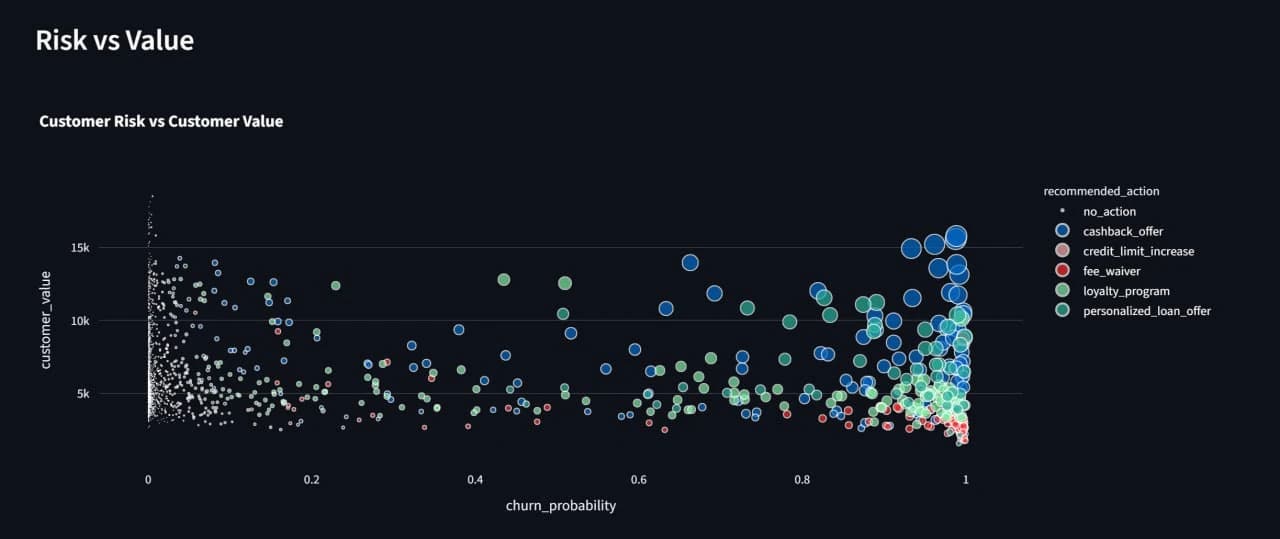
Most of the book does not need an offer. Mass cashback hits everyone, including the customers who were never going to leave, and the money is gone whether it changed anything or not. A thin rule hits almost no one, which is safe and does nothing. Neither is a policy. The question is where risk and value actually meet, and that is a per-customer question a blanket campaign cannot ask.
What we built
Risk and value, scored separately
A churn probability and a customer value for every row. They are two different questions and combining them too early is what produces a campaign aimed at cheap customers who were leaving anyway.
One recommended action per customer
Each row maps to a single action — no action, cashback, a credit limit increase, a fee waiver, the loyalty programme, or a personalised loan offer — rather than a score an operator is left to interpret.
No action is an action
The large quiet part of the book is labelled explicitly rather than left out of the output. A retention tool whose recommendation is always to spend has not answered the question it was asked.
Four policies on the same book
No intervention, mass cashback, a rules approach and the agentic one, compared on expected profit and on how many customers each targets. The agentic row is one strategy in that table, not the premise of it.
A single-customer view
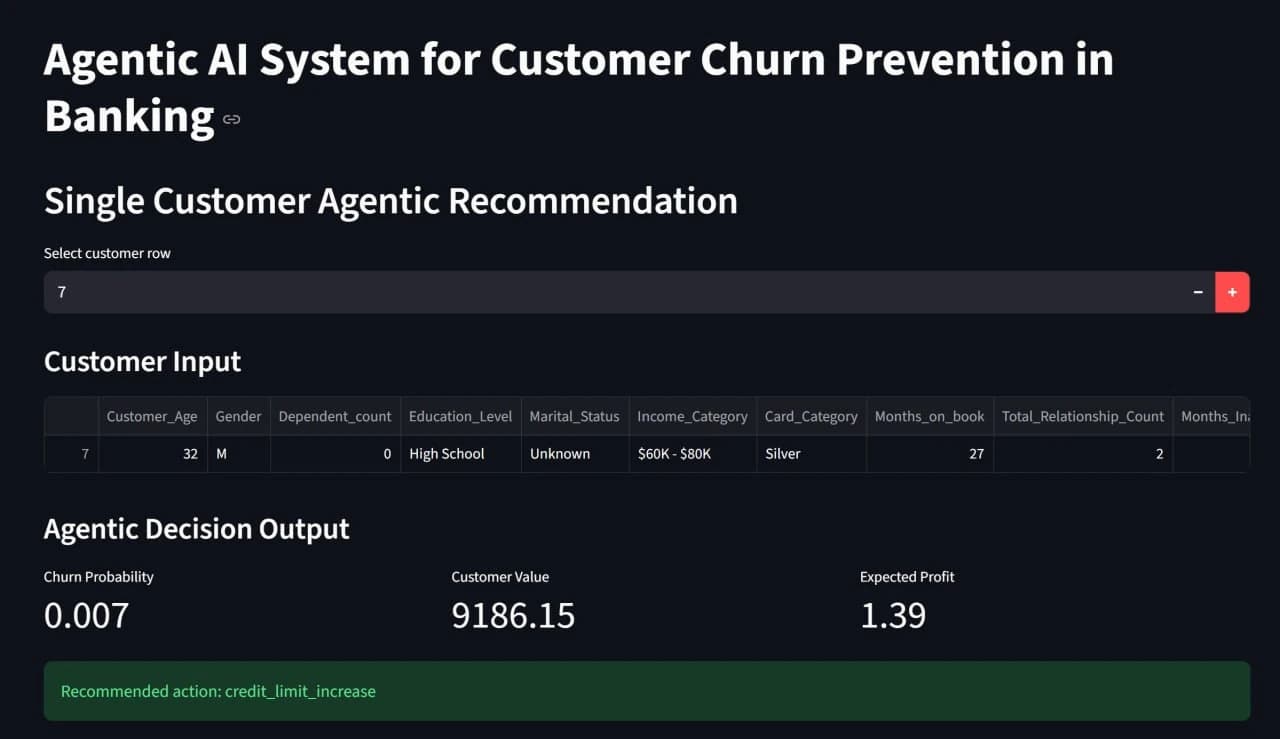
The inputs for one person on the screen, and the recommendation that came out of them. It is what makes the policy table arguable rather than something to accept on faith.
Technical approach
Score churn probability and customer value per row, map each row to an action, then compare the four policies on expected profit and on the number of customers targeted. Expected profit is what makes the comparison honest: an action that retains someone worth less than the offer is a loss the model has to be able to report. The figures on the screens are the model running on a dataset — the tool exists to compare policies, not to publish a result.
The product
Got something like this to build?
Start a conversation